Mixed-frequency signals
Question 1:
What is a harmonic frequency? If an oscillator circuit outputs a fundamental frequency of 12 kHz, calculate the frequencies of the following harmonics:
- �
- 1st harmonic =
- �
- 2nd harmonic =
- �
- 3rd harmonic =
- �
- 4th harmonic =
- �
- 5th harmonic =
- �
- 6th harmonic =
- �
- 1st harmonic = 12 kHz
- �
- 2nd harmonic = 24 kHz
- �
- 3rd harmonic = 36 kHz
- �
- 4th harmonic = 48 kHz
- �
- 5th harmonic = 60 kHz
- �
- 6th harmonic = 72 kHz
Notes:
Ask your students to determine the mathematical relationship between harmonic number, harmonic frequency, and fundamental frequency. It isn't difficult to figure out!
Question 2:
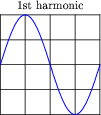
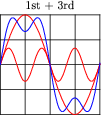
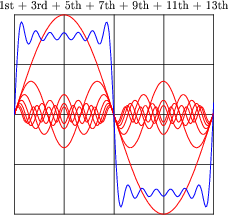
An interesting thing happens if we take the odd-numbered harmonics of a given frequency and add them together at certain diminishing ratios of the fundamental's amplitude. For instance, consider the following harmonic series:
(1 volt at 100 Hz) + (1/3 volt at 300 Hz) + (1/5 volt at 500 Hz) + (1/7 volt at 700 Hz) + . . .
|
|
|
|
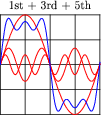
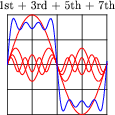
Here is what the composite wave would look like if we added all odd-numbered harmonics up to the 13th together, following the same pattern of diminishing amplitudes:
|
|
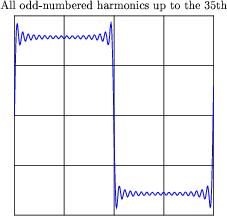
If we take this progression even further, you can see that the sum of these harmonics begins to appear more like a square wave:
|
|
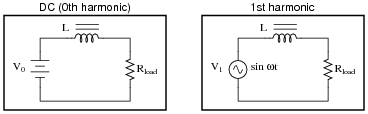
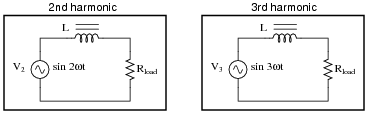
This mathematical equivalence between a square wave and the weighted sum of all odd-numbered harmonics is very useful in analyzing AC circuits where square-wave signals are present. From the perspective of AC circuit analysis based on sinusoidal waveforms, how would you describe the way an AC circuit "views" a square wave?
Follow-up question: explain how this equivalence between a square wave and a particular series of sine waves is a practical example of the Superposition Theorem at work.
Notes:
If you have access to a graphing calculator or a computer with graphing software installed, and a projector capable of showing the resulting graph(s), you may demonstrate this square-wave synthesis in front of the whole class. It makes an excellent illustration of the concept.
Discuss this with your students: that the relatively simple rules of AC circuit analysis (calculating reactance by wL and [1/(wC)], calculating impedance by the trigonometric sum of reactance and resistance, etc.) can be applied to the analysis of a square wave's effects if we repeat that analysis for every harmonic component of the wave.
This is truly a remarkable principle, that the effects of a complex waveform on a circuit may be determined by considering each of that waveform's harmonics separately, then those effects added together (superimposed) just as the harmonics themselves are superimposed to form the complex wave. Explain to your students how this superposition principle is not limited to the analysis of square waves, either. Any complex waveform whose harmonic constituents are known may be analyzed in this fashion.
Question 3:
In the early 1800's, French mathematician Jean Fourier discovered an important principle of waves that allows us to more easily analyze non-sinusoidal signals in AC circuits. Describe the principle of the Fourier series, in your own words.
- "Any periodic waveform, no matter how complex, is equivalent to a series of sinusoidal waveforms added together at different amplitudes and different frequencies, plus a DC component."
|
Notes:
So far, all the "tools" students have learned about reactance, impedance, Ohm's Law, and such in AC circuits assume sinusoidal waveforms. Being able to equate any non-sinusoidal waveform to a series of sinusoidal waveforms allows us to apply these ßinusoidal-only" tools to any waveform, theoretically.
An important caveat of Fourier's theorem is that the waveform in question must be periodic. That is, it must repeat itself on some fixed period of time. Non-repetitive waveforms do not reduce to a definite series of sinusoidal terms. Fortunately for us, a great many waveforms encountered in electronic circuits are periodic and therefore may be represented by, and analyzed in terms of, definite Fourier series.
It would be good to mention the so-called FFT algorithm in this discussion while you're on this topic: the digital algorithm that computers use to separate any sampled waveform into multiple constituent sinusoidal frequencies. Modern computer hardware is able to easily implement the FFT algorithm, and it finds extensive use in analytical and test equipment.
Question 4:
Identify the type of electronic instrument that displays the relative amplitudes of a range of signal frequencies on a graph, with amplitude on the vertical axis and frequency on the horizontal.
Challenge questions: two similar instruments are the wave analyzer and the Fourier analyzer. Explain how both these instruments are similar in function to a spectrum analyzer, and also how both differ.
Notes:
Spectrum analyzers capable of analyzing radio-frequency signals are very expensive, but low-cost personal computer hardware and software does a good job of analyzing complex audio signals. It would be a benefit to your class to have a low-frequency spectrum analyzer setup available for student use, and possible demonstration during discussion.
Question 5:
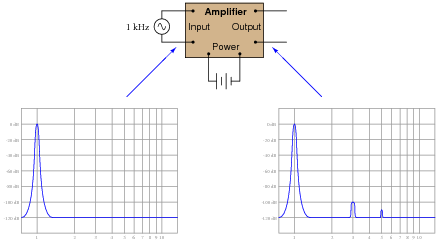
Suppose an amplifier circuit is connected to a sine-wave signal generator, and a spectrum analyzer used to measure both the input and the output signals of the amplifier:
|
|
Interpret the two graphical displays and explain why the output signal has more "peaks" than the input. What is this difference telling us about the amplifier's performance?
Notes:
The purpose of this question is to get students to realize the presence of harmonics means a departure from a once-perfect sinusoidal wave-shape. What used to be free of harmonics now contains harmonics, and this indicates distortion of the sine wave somewhere within the amplifier.
By the way, the perfectly flat "noise floor" at -120 dB is highly unusual. There will always be a "rough" floor shown on the display of a spectrum analyzer, but this is not pertinent to the question at hand so I omitted it for simplicity's sake.
Question 6:
What causes harmonics to form in the output of a transistor amplifier circuit, if the input waveform is perfectly sinusoidal (free from harmonics)? Be as specific as you can in your answer.
Notes:
Discuss with your students the nature of harmonics: how multiple sinusoidal waveforms are necessarily contained in any periodic waveform that is not perfectly sinusoidal itself.
Question 7:
What causes harmonics to form in the output of a transistor oscillator circuit such as a Colpitts or a Hartley, which is designed to produce a sinusoidal signal? Be as specific as you can in your answer.
Challenge question: Colpitts oscillators tend to produce "purer" sine-wave outputs than Hartley oscillators, all other factors being equal. Explain why.
Notes:
Discuss with your students the nature of harmonics: how multiple sinusoidal waveforms are necessarily contained in any periodic waveform that is not perfectly sinusoidal itself.
Question 8:
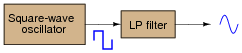
A clever way to produce sine waves is to pass the output of a square-wave oscillator through a low-pass filter circuit:
|
|
Explain how this principle works, based on your knowledge of Fourier's theorem.
Notes:
Ask your students what they think about the rolloff requirement for this LP filter. Will any LP filter work, or do we need something special?
Question 9:
What causes harmonics to form in AC electric power systems?
Notes:
My answer to this question is intentionally vague. It is correct, but does not reveal anything about the real nature of the cause, or more importantly, why a "nonlinear" load would cause harmonics. Discuss with your students what a "nonlinear" device is, and what it does to a sinusoidal signal to generate harmonics.
Question 10:
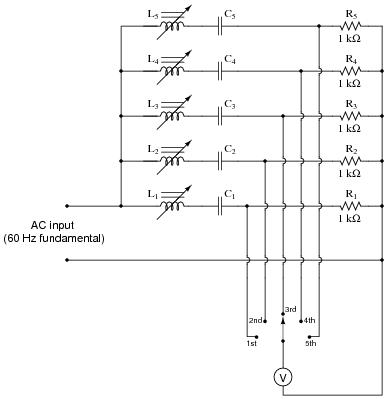
Explain how the following power-line harmonic analyzer circuit works:
|
|
-
Harmonic # L# value C# value
1st 20 to 22 H 0.33 mF
2nd 11 to 12 H 0.15 mF
3rd 5 to 6 H 0.15 mF
4th 1.5 to 2.5 H 0.22 mF
5th 1 to 1.5 H 0.27 mF
Follow-up question: calculate the exact inductance values necessary for precise tuning of the five LC filters, for the first five harmonics of a 60 Hz waveform.
Challenge question: the voltmeter in this circuit would not have to be a true-RMS meter. It could simply be an average-responding (RMS-calibrated) voltmeter and it would work the same. Explain why.
Notes:
This question provides students with some review of passive filter circuit theory, as well as insight into a practical circuit they could conceivably build as a project.
A very important design feature of this circuit is the narrow bandwidth of each harmonic "channel." The filter pass-bands must not come close to overlapping, or else the meter response will not be exclusively indicative of the harmonic it is switched to. High Q values for each filter section ensure that the meter will only register the particular harmonic that is selected for measurement.
Question 11:
What is a harmonic frequency? If a particular electronic system (such as an AC power system) has a fundamental frequency of 60 Hz, calculate the frequencies of the following harmonics:
- �
- 1st harmonic =
- �
- 2nd harmonic =
- �
- 3rd harmonic =
- �
- 4th harmonic =
- �
- 5th harmonic =
- �
- 6th harmonic =
- �
- 1st harmonic = 60 Hz
- �
- 2nd harmonic = 120 Hz
- �
- 3rd harmonic = 180 Hz
- �
- 4th harmonic = 240 Hz
- �
- 5th harmonic = 300 Hz
- �
- 6th harmonic = 360 Hz
Notes:
Ask your students to determine the mathematical relationship between harmonic number, harmonic frequency, and fundamental frequency. It isn't difficult to figure out!
Question 12:
An octave is a type of harmonic frequency. Suppose an electronic circuit operates at a fundamental frequency of 1 kHz. Calculate the frequencies of the following octaves:
- �
- 1 octave greater than the fundamental =
- �
- 2 octaves greater than the fundamental =
- �
- 3 octaves greater than the fundamental =
- �
- 4 octaves greater than the fundamental =
- �
- 5 octaves greater than the fundamental =
- �
- 6 octaves greater than the fundamental =
- �
- 1 octave greater than the fundamental = 2 kHz
- �
- 2 octaves greater than the fundamental = 4 kHz
- �
- 3 octaves greater than the fundamental = 8 kHz
- �
- 4 octaves greater than the fundamental = 16 kHz
- �
- 5 octaves greater than the fundamental = 32 kHz
- �
- 6 octaves greater than the fundamental = 64 kHz
Notes:
Ask your students if they can determine the mathematical relationship between octave number, octave frequency, and fundamental frequency. This is a bit more difficult to do than for integer harmonics, but not beyond reason if students are familiar with exponents.
Clarify for your students the fact that öctave" is not just a musical term. In electronic circuit analysis (especially filter circuits), the word öctave" is often used to represent multiples of a given frequency, usually in reference to a bandwidth (i.e. "This filter's passband response is essentially flat over two octaves!").
Question 13:
The Fourier series for a square wave is as follows:
|
Where,
Vm = Peak amplitude of square wave
w = Angular velocity of square wave (equal to 2 pf, where f is the fundamental frequency)
n = An odd integer
Electrically, we might represent a square-wave voltage source as a circle with a square-wave symbol inside, like this:

|
|
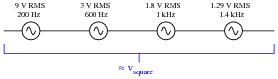
Knowing the Fourier series of this voltage, however, allows us to represent the same voltage source as a set of series-connected voltage sources, each with its own (sinusoidal) frequency. Draw the equivalent schematic for a 10 volt (peak), 200 Hz square-wave source in this manner showing only the first four harmonics, labeling each sinusoidal voltage source with its own RMS voltage value and frequency:
Hint: w = 2 pf
|
|
Notes:
To be honest, the four-harmonic equivalent circuit is a rather poor approximation for a square wave. The real purpose of this question, though, is to have students relate the sinusoidal terms of a common Fourier series (for a square wave) to a schematic diagram, translating between angular velocity and frequency, peak values and RMS values.
Please note that the voltage magnitudes shown in the answer are RMS and not peak! If you were to calculate peak sinusoid source values, you would obtain these results:
- �
- 1st harmonic: [40/(p)] volts peak = 12.73 volts peak
- �
- 3rd harmonic: [40/(3 p)] volts peak = 4.244 volts peak
- �
- 5th harmonic: [40/(5 p)] volts peak = 2.546 volts peak
- �
- 7th harmonic: [40/(7 p)] volts peak = 1.819 volts peak
Question 14:
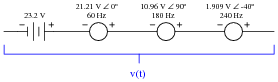
Suppose a non-sinusoidal voltage source is represented by the following Fourier series:
|
Electrically, we might represent this non-sinusoidal voltage source as a circle, like this:

|
|
Knowing the Fourier series of this voltage, however, allows us to represent the same voltage source as a set of series-connected voltage sources, each with its own (sinusoidal) frequency. Draw the equivalent schematic in this manner, labeling each voltage source with its RMS voltage value, frequency (in Hz), and phase angle:
Hint: w = 2 pf
|
|
Notes:
The purpose of this question is to have students relate the sinusoidal terms of a particular Fourier series to a schematic diagram, translating between angular velocity and frequency, peak values and RMS values.
Question 15:
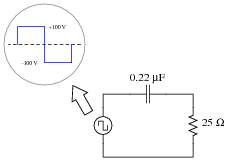
Calculate the power dissipated by a 25 W resistor, when powered by a square-wave with a symmetrical amplitude of 100 volts and a frequency of 2 kHz:
|
|
Notes:
To calculate this power figure, students have to determine the RMS value of the square wave. Thankfully, this is not difficult.
Question 16:
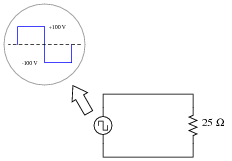
Calculate the power dissipated by a 25 W resistor, when powered by a square-wave with a symmetrical amplitude of 100 volts and a frequency of 2 kHz, through a 0.22 mF capacitor:
|
|
No, I'm not asking you to calculate an infinite number of terms in the Fourier series - that would be cruel and unusual. Just calculate the power dissipated in the resistor by the 1st, 3rd, 5th, and 7th harmonics only.
PR(3rd) = 1.485 watts
PR(5th) = 1.384 watts
PR(7th) = 1.255 watts
PR(1+3+5+7) = 5.665 watts
Notes:
To calculate this power figure, students have to research the Fourier series for a square wave. Many textbooks use square waves to introduce the subject of Fourier series, so this should not be difficult for students to find.
Ask your students how the real power dissipated by this resistor compares with the final figure of 5.665 watts. Is the real power dissipation more, less, or equal to this figure? If not equal, what would we have to do to arrive at a more precise figure?
Question 17:
Ideally, a sinusoidal oscillator will output a signal consisting of a single (fundamental) frequency, with no harmonics. Realistically, though, sine-wave oscillators always exhibit some degree of distortion, and are therefore never completely harmonic-free.
Describe what the display of a spectrum analyzer would look like when connected to the output of a perfect sinusoidal oscillator. Then, describe what the same instrument's display would look like if the oscillator exhibited substantial distortion.
Notes:
The purpose of this question is to get students to think about how a spectrum analyzer would be used in a practical scenario, and what the spectrum would look like for a couple of different scenarios. Really, it focuses more on the harmonic analysis instrument (the spectrum analyzer) more than the oscillator circuit.
Question 18:
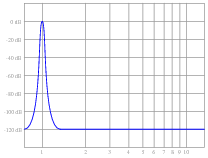
An electronics technician connects the input of a spectrum analyzer to the secondary winding of an AC power transformer, plugged into a power receptacle. He sets the spectrum analyzer to show 60 Hz as the fundamental frequency, expecting to see the following display:
|
|
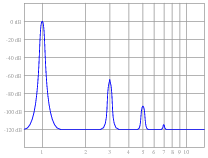
Instead, however, the spectrum analyzer shows more than just a single peak at the fundamental:
|
|
Explain what this pattern means, in practical terms. Why is this power system's harmonic signature different from what the technician expected to see?
Notes:
Note to your students that this is quite typical for modern power systems, due to the prevalence of switching power supply circuits and other "non-linear" electrical loads. The presence of harmonic frequencies in significant quantity can cause severe problems for power systems, including transformer overheating, motor overheating, overloaded neutral conductors (especially in three-phase, four-wire "Wye" systems), and excessive currents through power-factor correction capacitors.
Question 19:
Ideally, an amplifier circuit increases the amplitude of a signal without altering the signal's wave-shape in the least. Realistically, though, amplifiers always exhibit some degree of distortion.
Describe how harmonic analysis - either with a spectrum analyzer or some other piece of test equipment capable of measuring harmonics in a signal - is used to quantify the distortion of an amplifier circuit.
Notes:
The answer given is purposefully vague. All I did is describe what gets connected to the amplifier, not how to interpret the measurements. Ask your students to explain why a pure sine wave is chosen as the test signal, and what sort of response would be considered ideal to see on the spectrum analyzer.
Question 20:
Under certain conditions, harmonics may be produced in AC power systems by inductors and transformers. How is this possible, as these devices are normally considered to be linear?
Notes:
Ask your students what it means for an electrical or electronic device to be "linear." How many devices qualify as linear? And of those devices, are they always linear, or are they capable of nonlinear behavior under special conditions?
Use the discussion time to review B-H curves for ferromagnetic materials with your students, asking them to draw the curves and point out where along those curves inductors and transformers normally operate. What conditions, specifically, would make an iron-core device act nonlinearly?
On a similar note, the (slightly) nonlinear nature of ferromagnetic core transformers is known to permit signals to modulate each other in certain audio amplifier designs, to produce a specific kind of audio signal distortion known as intermodulation distortion. Normally, modulation is a function possible only in nonlinear systems, so the fact that modulation occurs in a transformer is proof positive of (at least some degree of) nonlinearity.
Question 21:
Identify some ways in which harmonics may be mitigated in AC power systems, since they tend to cause trouble for a variety of electrical components.
Notes:
The answer given here is correct, but vague. I did not specify the type of filter or exactly how it might be connected to a load. These are questions to ask your students during discussion.
Question 22:
|
�f(x) dx Calculus alert! |
|
|
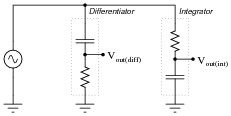
If, however, the excitation voltage is slightly distorted, one of the outputs will be more sinusoidal than the other. Explain whether it is the differentiator or the integrator that produces the signal most resembling a pure sine wave, and why.
Hint: I recommend building this circuit and powering it with a triangle wave, to simulate a mildly distorted sine wave.
|
|
|
|
|
|
Notes:
As an interesting footnote, this is precisely why differentiation is rarely performed on real-world signals. Since the frequency of noise often exceeds the frequency of the signal, differentiating a "noisy" signal will only lead to a decreased signal-to-noise ratio.
For a practical example of this, tell your students about vibration measurement, where it is more common to calculate velocity based on time-integration of an acceleration signal than it is to calculate acceleration based on time-differentiation of a velocity signal.
Question 23:
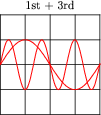
Note the effect of adding the second harmonic of a waveform to the fundamental, and compare that effect with adding the third harmonic of a waveform to the fundamental:
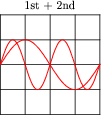
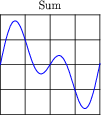
|
|
|
|
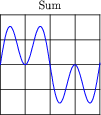
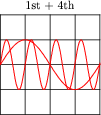
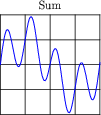
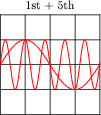
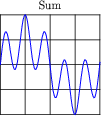
Now compare the sums of a fundamental with its fourth harmonic, versus with its fifth harmonic:
|
|
|
|
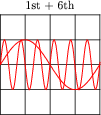
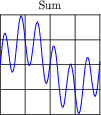
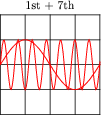
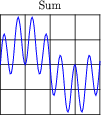
And again for the 1st + 6th, versus the 1st + 7th harmonics:
|
|
|
|
Examine these sets of harmonic sums, and indicate the trend you see with regard to harmonic number and symmetry of the final (Sum) waveforms. Specifically, how does the addition of an even harmonic compare to the addition of an odd harmonic, in terms of final waveshape?
Challenge question: explain why this is the case, any way you can.
Notes:
Although the sequence of images presented in the question by no means constitutes a formal proof, it should lead students to observe a trend: that odd harmonics do not make a waveform unsymmetrical about the horizontal axis, whereas even harmonics do. Given these two facts, we may make qualitative judgments about the harmonic content of a waveform simply by visually checking for symmetry about the horizontal axis.
Incidentally, some students have a difficult time grasping the concept of symmetry about the horizontal axis of a waveform. Take this simple example, which is symmetrical about its horizontal centerline:
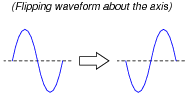
|
|
Some students will protest that this waveform is not symmetrical about its centerline, because it does not look exactly the same as before after flipping. They must bear in mind, though, that this is just one cycle of a continuous waveform. In reality, the waveform looks like this before and after flipping:
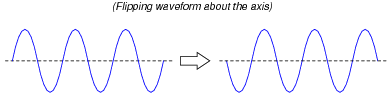
|
|
All one needs to do to see that these two waveforms are indeed identical is to do a 180 degree phase shift (shifting either to the left or to the right):
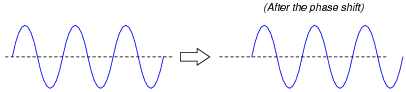
|
|
By contrast, a waveform without symmetry about the horizontal axis cannot be made to look the same after flipping, no matter what subsequent phase shift is given to it:
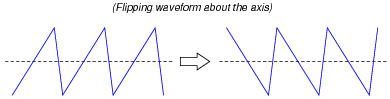
|
|
Another way to describe this asymmetry is in terms of the waveform's departure from the centerline, compared to its return to the centerline. Is the rate-of-change ([dv/dt] for a voltage waveform) equal in magnitude and opposite in sign at each of these points, or is there a difference in magnitude as well? Discuss ways to identify this type of asymmetry, and what it means in terms of harmonic content.
Mathematically, this symmetry is defined as such:
|
Where,
f(t) = Function of waveform with time as the independent variable
t = Time
T = Period of waveform, in same units of time as t
Question 24:
When technicians and engineers consider harmonics in AC power systems, they usually only consider odd-numbered harmonic frequencies. Explain why this is.
Notes:
I've had electrical power system experts confidently tell me that even-numbered harmonics cannot exist in AC power systems, due to some deep mathematical principle mysteriously beyond their ability to describe or explain. Rubbish! Even-numbered harmonics can and do appear in AC power systems, although they are typically much lower in amplitude than the odd-numbered harmonics due to the nature of most nonlinear loads.
If you ever wish to prove the existence of even-numbered harmonics in a power system, all you have to do is analyze the input current waveform of a half-wave rectifier!
Question 25:
By visual inspection, determine which of the following waveforms contain even-numbered harmonics:
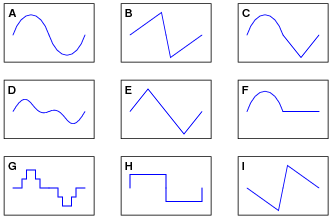
|
|
Note that only one cycle is shown for each waveform. Remember that we're dealing with continuous waveforms, endlessly repeating, and not single cycles as you see here.
Notes:
Ask your students how they were able to discern the presence of even-numbered harmonics by visual inspection. This typically proves difficult for some of my students whose spatial-relations skills are weak. These students need some sort of algorithmic (step-by-step) procedure to see what other students see immediately, and discussion time is a great opportunity for students to share technique.
Mathematically, this symmetry is defined as such:
|
Where,
f(t) = Function of waveform with time as the independent variable
t = Time
T = Period of waveform, in same units of time as t
Question 26:
By visual inspection, determine which of the following waveforms contain even-numbered harmonics:
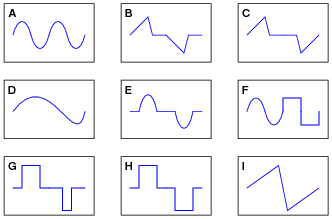
|
|
Note that only one cycle is shown for each waveform. Remember that we're dealing with continuous waveforms, endlessly repeating, and not single cycles as you see here.
Notes:
Ask your students how they were able to discern the presence of even-numbered harmonics by visual inspection. This typically proves difficult for some of my students whose spatial-relations skills are weak. These students need some sort of algorithmic (step-by-step) procedure to see what other students see immediately, and discussion time is a great opportunity for students to share technique.
Mathematically, this symmetry is defined as such:
|
Where,
f(t) = Function of waveform with time as the independent variable
t = Time
T = Period of waveform, in same units of time as t
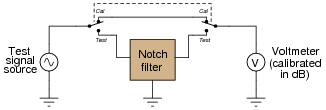
Question 27:
A crude measurement circuit for harmonic content of a signal uses a notch filter tuned to the fundamental frequency of the signal being measured. Examine the following circuit and then explain how you think it would work:
|
|
Notes:
This test circuit relies on the assumption that the notch filter is perfect (i.e. that its attenuation in the stop-band is complete). Since no filter is perfect, it would be a good idea to ask your students what effect they think an imperfect notch filter would have on the validity of the test. In other words, what will a notch filter that lets a little bit of the fundamental frequency through do to the "test" measurement?
Question 28:
Radio communication functions on the general principle of high-frequency AC power being modulated by low-frequency data. Two common forms of modulation are Amplitude Modulation (AM) and Frequency Modulation (FM). In both cases, the modulation of a high frequency waveform by a lower-frequency waveform produces something called sidebands.
Describe what ßidebands" are, to the best of your ability.
Notes:
Be sure to ask your students what ÄM" and "FM" mean, before they present their answers on sidebands.
The answer makes frequent use of the word carrier without defining it. This is another intentional ömission" designed to make students do their research. If they have taken the time to find information on sidebands, they will surely discover what the word "carrier" means. Ask them to define this word, in addition to their description of sidebands.
Question 29:
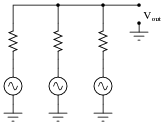
The following circuit is a simple mixer circuit, combining three AC voltage signals into one, to be measured by an oscilloscope:
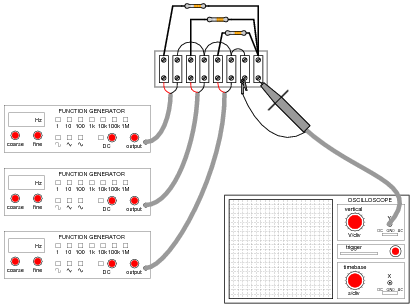
|
|
Draw a schematic diagram of this circuit, to make it easier to analyze.
Is it possible to filter the three constituent input signals from each other in the resulting output signal, or are they irrevocably affected by one another when they "mix" together in this resistor network? How does the superposition principle relate to the operation of a mixer circuit like this?
What if the mixing circuit contains capacitors and inductors rather than resistors? Does the same principle apply? Why or why not?
|
|
The ßuperposition principle" states that when two or more waveforms mix together in a linear network, the result is the sum of the waveforms. That is, the waveforms simply add up to make a total, and are not ïrrevocably affected" by one another. The question, then, is really: what constitutes a linear network?
Notes:
It is no coincidence that the ßuperposition principle" sounds a lot like the ßuperposition theorem" learned as a network analysis technique: consider the effects of all power sources one at a time, and add those effects together to determine the final result.
The matter of ïrrevocable influence" is important to us because it dictates how difficult it would be to separate the mixed signals from each other. When external noise couples to a circuit through capacitive or inductive coupling, can we filter out the noise and obtain the true signal again, or has the signal been corrupted in such a way that restoration is impossible by mere filtering? The key to answering this question is whether or not the "network" formed from parasitic capacitive/inductive coupling is linear. Discuss with your students what determines linearity in a math equation, and apply these criteria to the equations describing resistor, capacitor, and inductor behavior.
Question 30:
What is a musical chord? If viewed on an oscilloscope, what would the signal for a chord look like?
Note: if you want to see this form yourself without going through the trouble of setting up a musical keyboard (or piano) and oscilloscope, you may simulate it using a graphing calculator or computer program. Simply graph the sum of three waveforms with the following frequencies:
- �
- 261.63 Hz (middle "C")
- �
- 329.63 Hz (Ë")
- �
- 392.00 Hz ("G")
Notes:
Students with a musical background (especially piano) should be able to add substantially to the discussion on this question. The important concept to discuss here is that multiple frequencies of any signal form (AC voltage, current, sound waves, light waves, etc.) are able to exist simultaneously along the same signal path without interference.
Question 31:
The Fourier series is much more than a mathematical abstraction. The mathematical equivalence between any periodic waveform and a series of sinusoidal waveforms can be a powerful analytical tool for the electronic engineer and technician alike.
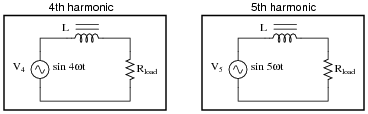
Explain how knowing the Fourier series for a particular non-sinusoidal waveform simplifies the analysis of an AC circuit. For example, how would our knowledge of a square wave's Fourier series help in the analysis of this circuit?
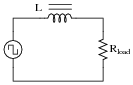
|
|
|
|
|
|
|
|
Notes:
At first, some students have trouble understanding exactly how Fourier analysis is helpful in any practical way as an analytical tool. The purpose of this question is to have them see how it might be applied to something they are familiar with: an LR circuit.