AC phase
Question 1:
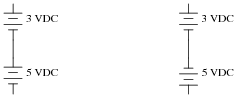
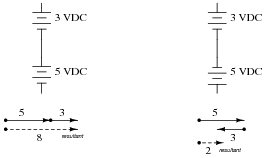
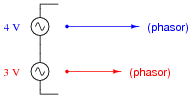
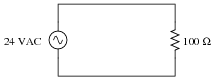
If we were to express the series-connected DC voltages as phasors (arrows pointing with a particular length and a particular direction, graphically expressing magnitude and polarity of an electrical signal), how would we draw them in such a way that the total (or resultant) phasors accurately expressed the total voltage of each series-connected pair?
|
|
If we were to assign angle values to each of these phasors, what would you suggest?
|
|
In the right-hand circuit, where the two voltage sources are opposing, one of the phasors will have an angle of 0o, while the other will have an angle of 180o.
Notes:
Phasors are really nothing more than an extension of the familiar "number line" most students see during their primary education years. The important difference here is that phasors are two-dimensional magnitudes, not one-dimensional, as scalar numbers are.
The use of degrees to measure angles should be familiar as well, even to those students without a strong mathematics background. For example, what does it mean when a skateboarder or stunt bicyclist "does a 180"? It means they turn around so as to face the opposite direction (180 degrees away from) their previous direction.
Question 2:
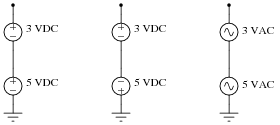
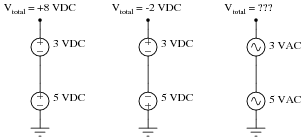
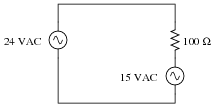
Calculate the total voltage of these series-connected voltage sources:
|
|
|
|
Notes:
Discuss with your students exactly why the total voltage of the two series-connected AC sources cannot be determined, given the little information we have about them. Is it possible for their total voltage to be 8 VAC, just like the series-aiding DC sources? Is it possible for their total voltage to be 2 VAC, just like the series-opposing DC sources? Why or why not?
Question 3:
Using a computer or graphing calculator, plot the sum of these two sine waves:
|
|
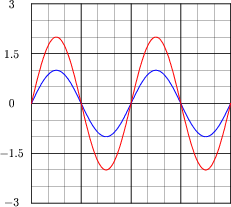
What do you suppose the sum of a 1-volt (peak) sine wave and a 2-volt (peak) sine wave will be, if both waves are perfectly in-phase with each other?
Hint: you will need to enter equations into your plotting device that look something like this:
y1 = sin x
y2 = 2 * sin x
y3 = y1 + y2
|
|
Notes:
Graphing calculators are excellent tools to use for learning experiences such as this. In far less time than it would take to plot a third sine wave by hand, students may see the sinusoidal sum for themselves.
Question 4:
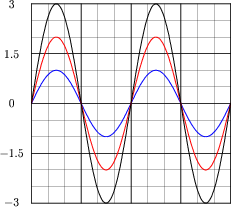
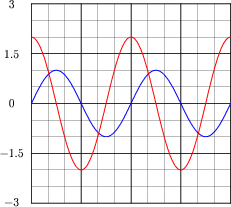
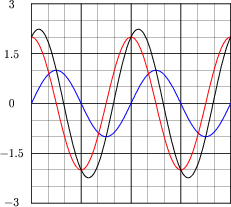
Using a computer or graphing calculator, plot the sum of these two sine waves:
|
|
Hint: you will need to enter equations into your plotting device that look something like this:
y1 = sin x
y2 = 2 * sin (x + 90)
y3 = y1 + y2
Note: the second equation assumes your calculator has been set up to calculate trigonometric functions in angle units of degrees rather than radians. If you wish to plot these same waveforms (with the same phase shift shown) using radians as the unit of angle measurement, you must enter the second equation as follows:
y2 = 2 * sin (x + 1.5708)
|
|
Follow-up question: note that the sum of the 1-volt wave and the 2-volt wave does not equate to a 3-volt wave! Explain why.
Notes:
Graphing calculators are excellent tools to use for learning experiences such as this. In far less time than it would take to plot a third sine wave by hand, students may see the sinusoidal sum for themselves.
The point of this question is to get students thinking about how it is possible for sinusoidal voltages to not add up as one might expect. This is very important, because it indicates simple arithmetic processes like addition will not be as simple in AC circuits as it was in DC circuits, due to phase shift. Be sure to emphasize this point to your students.
Question 5:
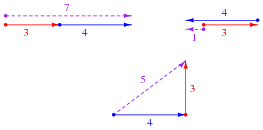
Special types of vectors called phasors are often used to depict the magnitude and phase-shifts of sinusoidal AC voltages and currents. Suppose that the following phasors represent the series summation of two AC voltages, one with a magnitude of 3 volts and the other with a magnitude of 4 volts:
|
|
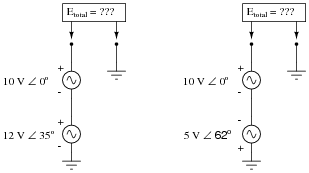
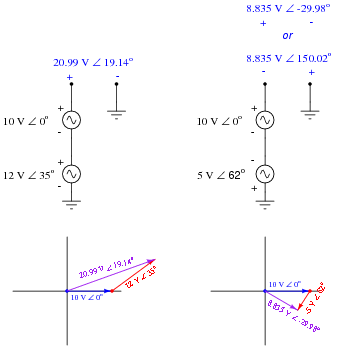
Explain what each of the following phasor diagrams represents, in electrical terms:
|
|
Also explain the significance of these sums: that we may obtain three different values of total voltage (7 volts, 1 volt, or 5 volts) from the same series-connected AC voltages. What does this mean for us as we prepare to analyze AC circuits using the rules we learned for DC circuits?
Please note that these three possibilities are not exhaustive! There are a multitude of other possible total voltages that the series-connected 3 volt and 4 volt sources may create.
Follow-up question: in DC circuits, it is permissible to connect multiple voltage sources in parallel, so long as the voltages (magnitudes) and polarities are the same. Is this also true for AC? Why or why not?
Notes:
Be sure to discuss with your students that these three conditions shown are not the only conditions possible! I simply chose 0o, 180o, and 90o because they all resulted in round sums for the given quantities.
The follow-up question previews an important subject concerning AC phase: the necessary synchronization or paralleled AC voltage sources.
Question 6:
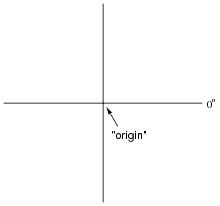
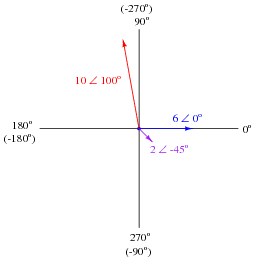
When drawing phasor diagrams, there is a standardized orientation for all angles used to ensure consistency between diagrams. This orientation is usually referenced to a set of perpendicular lines, like the x and y axes commonly seen when graphing algebraic functions:
|
|
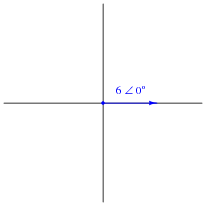
The intersection of the two axes is called the origin, and straight horizontal to the right is the definition of zero degrees (0o). Thus, a phasor with a magnitude of 6 and an angle of 0o would look like this on the diagram:
|
|
Draw a phasor with a magnitude of 10 and an angle of 100 degrees on the above diagram, as well as a phasor with a magnitude of 2 and an angle of -45 degrees. Label what directions 90o, 180o, and 270o would indicate on the same diagram.
|
|
Notes:
Graph paper, a ruler, and a protractor may be helpful for your students as they begin to draw and interpret phasor diagrams. Even if they have no prior knowledge of trigonometry or phasors, they should still be able to graphically represent simple phasor systems and even solve for resultant phasors.
Question 7:
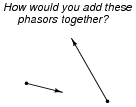
What does it mean to add two or more phasors together, in a geometric sense? How would one draw a phasor diagram showing the following two phasors added together?
|
|
|
|
Follow-up question: how would you verbally explain the process of phasor addition? If you were to describe to someone else how to add phasors together, what would you tell them?
Notes:
Discuss with your students that phasors may also be subtracted, multiplied, and divided. Subtraction is not too difficult to visualize, but addition and multiplication defies geometric understanding for many.
Question 8:
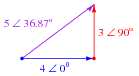
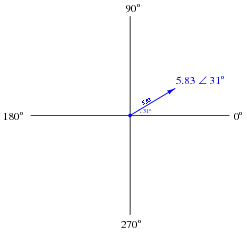
Determine the sum of these two phasors, and draw a phasor diagram showing their geometric addition:
(4 � 0o) + (3 � 90o)
How might a phasor arithmetic problem such as this relate to an AC circuit?
|
|
Notes:
It is very helpful in a question such as this to graphically depict the phasors. Have one of your students draw a phasor diagram on the whiteboard for the whole class to observe and discuss.
The relation of this arithmetic problem to an AC circuit is a very important one for students to grasp. It is one thing for students to be able to mathematically manipulate and combine phasors, but quite another for them to smoothly transition between a phasor operation and comprehension of voltages and/or currents in an AC circuit. Ask your students to describe what the magnitude of a phasor means (in this example, the number 5), if that phasor represents an AC voltage. Ask your students to describe what the angle of an AC voltage phasor means, as well (in this case, 36.87o), for an AC voltage.
Question 9:
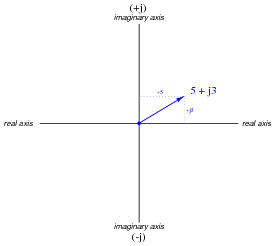
Phasors may be symbolically described in two different ways: polar notation and rectangular notation. Explain what each of these notations means, and why either one may adequately describe a phasor.
|
|
Rectangular notation describes a phasor in terms of horizontal and vertical displacement:
|
|
Follow-up question: why do we need the letter j in rectangular notation? What purpose does it serve, and what does it mean?
Notes:
When discussing the meaning of j, it might be good to explain what imaginary numbers are. Whether or not you choose to do this depends on the mathematical aptitude and background of your students.
Question 10:
These two phasors are written in a form known as polar notation. Re-write them in rectangular notation:
|
|
Challenge question: what does the lower-case j or i represent, in mathematical terms?
Notes:
Discuss with your students the two notations commonly used with phasors: polar and rectangular form. They are merely two different ways of ßaying" the same thing. A helpful "prop" for this discussion is the complex number plane (as opposed to a number line - a one-dimensional field), showing the "real" and ïmaginary" axes, in addition to standard angles (right = 0o, left = 180o, up = 90o, down = 270o). Your students should be familiar with this from their research, so have one of them draw the number plane on the whiteboard for all to view.
The challenge question regards the origin of complex numbers, beginning with the distinction of ïmaginary" numbers as being a separate set of quantities from "real" numbers. Electrical engineers, of course, avoid using the lower-case letter i to denote ïmaginary" because it would be so easily be confused with the standard notation for instantaneous current i.
Question 11:
In this graph of two AC voltages, which one is leading and which one is lagging?

|
|
If the 4-volt (peak) sine wave is denoted in phasor notation as 4 V � 0o, how should the 3-volt (peak) waveform be denoted? Express your answer in both polar and rectangular forms.
If the 4-volt (peak) sine wave is denoted in phasor notation as 4 V � 90o, how should the 3-volt (peak) waveform be denoted? Express your answer in both polar and rectangular forms.
If the 4-volt waveform is denoted as 4 V � 0o, then the 3-volt waveform should be denoted as 3 V � -90o, or 0 - j3 V.
If the 4-volt waveform is denoted as 4 V � 90o (0 + j4 V in rectangular form), then the 3-volt waveform should be denoted as 3 V � 0o, or 3 + j0 V.
Notes:
In my years of teaching, I have been surprised at how many students struggle with identifying the "leading" and "lagging" waveforms on a time-domain graph. Be sure to discuss this topic well with your students, identifying methods for correctly distinguishing "leading" waves from "lagging" waves.
This question also provides students with good practice expressing leading and lagging waves in phasor notation. One of the characteristics of phasors made evident in the answer is the relative nature of angles. Be sure to point this out to your students.
Question 12:
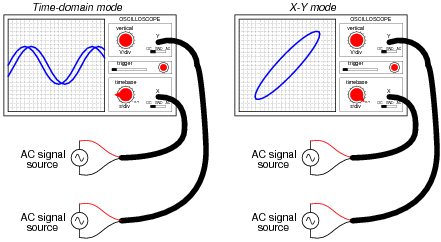
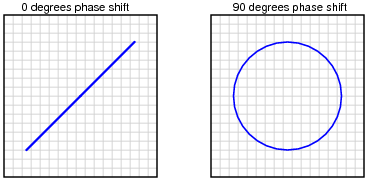
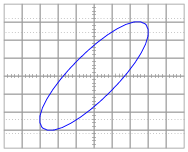
A common feature of oscilloscopes is the X-Y mode, where the vertical and horizontal plot directions are driven by external signals, rather than only the vertical direction being driven by a measured signal and the horizontal being driven by the oscilloscope's internal sweep circuitry:
|
|
The oval pattern shown in the right-hand oscilloscope display of the above illustration is typical for two sinusoidal waveforms of the same frequency, but slightly out of phase with one another. The technical name for this type of X-Y plot is a Lissajous figure.
What should the Lissajous figure look like for two sinusoidal waveforms that are at exactly the same frequency, and exactly the same phase (0 degrees phase shift between the two)? What should the Lissajous figure look like for two sinusoidal waveforms that are exactly 90 degrees out of phase?
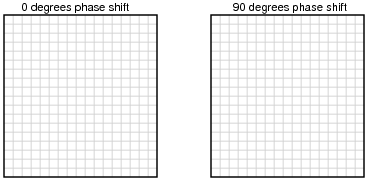
A good way to answer each of these questions is to plot the specified waveforms over time on graph paper, then determine their instantaneous amplitudes at equal time intervals, and then determine where that would place the "dot" on the oscilloscope screen at those points in time, in X-Y mode. To help you, I'll provide two blank oscilloscope displays for you to draw the Lissajous figures on:
|
|
|
|
Challenge question: what kind of Lissajous figures would be plotted by the oscilloscope if the signals were non-sinusoidal? Perhaps the simplest example of this would be two square waves instead of two sine waves.
Notes:
Many students seem to have trouble grasping how Lissajous figures are formed. One of the demonstrations I use to overcome this conceptual barrier is an analog oscilloscope and two signal generators set to very low frequencies, so students can see the "dot" being swept across the screen by both waveforms in slow-motion. Then, I speed up the signals and let them see how the Lissajous pattern becomes more ßolid" with persistence of vision and the inherent phosphor delay of the screen.
Question 13:
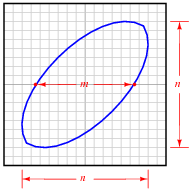
Lissajous figures, drawn by an oscilloscope, are a powerful tool for visualizing the phase relationship between two waveforms. In fact, there is a mathematical formula for calculating the amount of phase shift between two sinusoidal signals, given a couple of dimensional measurements of the figure on the oscilloscope screen.
The procedure begins with adjusting the vertical and horizontal amplitude controls so that the Lissajous figure is proportional: just as tall as it is wide on the screen (n). Then, we make sure the figure is centered on the screen and we take a measurement of the distance between the x-axis intercept points (m), as such:
|
|
Determine what the formula is for calculating the phase shift angle for this circuit, given these dimensions. Hint: the formula is trigonometric! If you don't know where to begin, recall what the respective Lissajous figures look like for a 0o phase shift and for a 90o phase shift, and work from there.
|
Challenge question: what kind of Lissajous figure would be drawn by two sinusoidal waveforms at slightly different frequencies?
Notes:
This is a great exercise in teaching students how to derive an equation from physical measurements when the fundamental nature of that equation (trigonometric) is already known. They should already know what the Lissajous figures for both 0o and 90o look like, and should have no trouble figuring out what a and b values these two scenarios would yield if measured similarly on the oscilloscope display. The rest is just fitting the pieces together so that the trigonometric function yields the correct angle(s).
Question 14:
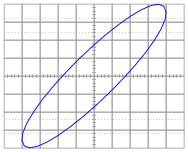
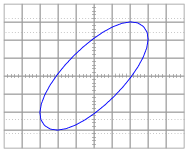
Calculate the amount of phase shift indicated by this Lissajous figure:
|
|
Notes:
This question is nothing more than an exercise in Lissajous figure interpretation.
Question 15:
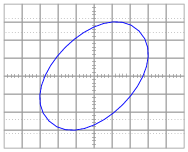
Calculate the amount of phase shift indicated by this Lissajous figure:
|
|
Notes:
This question is nothing more than an exercise in Lissajous figure interpretation.
Question 16:
Calculate the amount of phase shift indicated by this Lissajous figure:
|
|
Notes:
This question is nothing more than an exercise in Lissajous figure interpretation.
Question 17:
Calculate the amount of phase shift indicated by this Lissajous figure:
|
|
Notes:
This question is nothing more than an exercise in Lissajous figure interpretation.
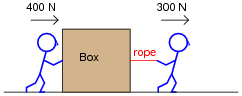
Question 18:
Suppose two people work together to slide a large box across the floor, one pushing with a force of 400 newtons and the other pulling with a force of 300 newtons:
|
|
The resultant force from these two persons' efforts on the box will, quite obviously, be the sum of their forces: 700 newtons (to the right).
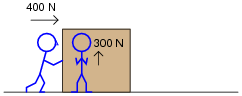
What if the person pulling decides to change position and push sideways on the box in relation to the first person, so the 400 newton force and the 300 newton force will be perpendicular to each other (the 300 newton force facing into the page, away from you)? What will the resultant force on the box be then?
|
|
Notes:
This is a non-electrical application of vector summation, to prepare students for the concept of using vectors to add voltages that are out-of-phase. Note how I chose to use multiples of 3, 4, and 5 for the vector magnitudes.
Question 19:
In this phasor diagram, determine which phasor is leading and which is lagging the other:

|
|
Follow-up question: using a protractor, estimate the amount of phase shift between these two phasors.
Notes:
It may be helpful to your students to remind them of the standard orientation for phase angles in phasor diagrams (0 degrees to the right, 90 degrees up, etc.).
Question 20:
Is it appropriate to assign a phasor angle to a single AC voltage, all by itself in a circuit?
|
|
What if there is more than one AC voltage source in a circuit?
|
|
Angles may be associated with multiple AC voltage sources in the same circuit, but only if those voltages are all at the same frequency.
Notes:
Discuss with your students the notion of "phase angle" in relation to AC quantities. What does it mean, exactly, if a voltage is "3 volts at an angle of 90 degrees"? You will find that such a description only makes sense where there is another voltage (i.e., "4 volts at 0 degrees") to compare to. Without a frame of reference, phasor angles are meaningless.
Also discuss with your students the nature of phase shifts between different AC voltage sources, if the sources are all at different frequencies. Would the phase angles be fixed, or vary over time? Why? In light of this, why do we not assign phase angles when different frequencies are involved?
Question 21:
Determine the total voltage in each of these examples, drawing a phasor diagram to show how the total (resultant) voltage geometrically relates to the source voltages in each scenario:
|
|
|
|
Notes:
At first it may confuse students to use polarity marks (+ and -) for AC voltages. After all, doesn't the polarity of AC alternate back and forth, so as to be continuously changing? However, when analyzing AC circuits, polarity marks are essential for giving a frame of reference to phasor voltages, which like all voltages are measured between two points, and thus may be measured two different ways.
Question 22:
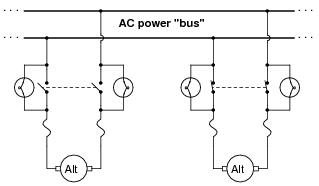
Before two or more operating alternators (AC generators) may be electrically coupled, they must be brought into synchronization with each other. If two alternators are out of ßync" (or out of phase) with each other, the result will be a large fault current when the disconnect switch is closed.
A simple and effective means of checking for ßync" prior to closing the disconnect switch for an alternator is to have light bulbs connected in parallel with the disconnect switch contacts, like this:
|
|
What should the alternator operator look for before closing the alternator switch? Do bright lights indicate a condition of being ïn-phase" with the bus, or do dim lights indicate this? What does the operator have to do in order to bring an alternator into "phase" with the bus voltage?
Also, describe what the light bulbs would do if the two alternators were spinning at slightly different speeds.
Notes:
Proper synchronization of alternators with bus voltage is a task that used to be performed exclusively by human operators, but may now be accomplished by automatic controls. It is still important, though, for students of electricity to understand the principles involved in alternator synchronization, and the simple light bulb technique of sync-indication is an excellent means of clarifying the concept.
Discuss with your students the means of bringing an alternator into phase with an AC bus. If the light bulbs are glowing brightly, what should the operator do to make them dim?
It might also be a good idea to discuss with your students what happens once two synchronized alternators become electrically coupled: the two machines become "locked" together as though they were mechanically coupled, thus maintaining synchronization from that point onward.
Question 23:
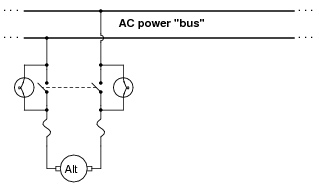
Suppose a power plant operator was about to bring this alternator on-line (connect it to the AC bus), and happened to notice that neither one of the synchronizing lights was lit at all. Thinking this to be unusual, the operator calls you to determine if something is wrong with the system. Describe what you would do to troubleshoot this system.
|
|
Notes:
There may be some students who suggest there is nothing wrong at all with the system. Indeed, since dim (or dark) lights normally indicate synchronization, would not the presence of two dim lights indicate that perfect synchronization had already been achieved? Discuss the likelihood of this scenario with your students, that two independent alternators could be maintaining perfect synchronization without being coupled together.
In regard to troubleshooting, this scenario has great potential for group discussion. Despite there being a simple, single, probable condition that could cause this problem, there are several possible component failures that could have created the condition. Different students will undoubtedly have different methods of approaching the problem. Let each one share their views, and discuss together what would be the best approach.
Question 24:
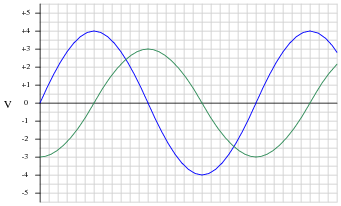
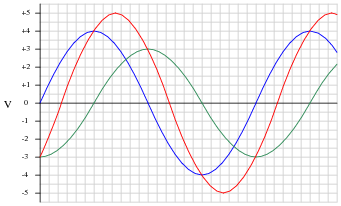
Shown here are two sine waves of equal frequency, superimposed on the same graph:
|
|
As accurately as possible, determine the amount of phase shift between the two waves, based on the divisions shown on the graph.
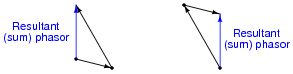
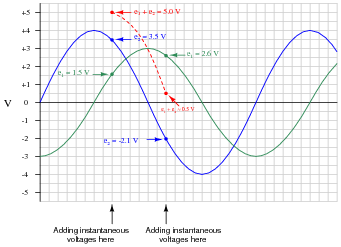
Also, plot a third sine wave that is the sum of the two sine waves shown. Again, do this as accurately as possible, based on the divisions shown on the graph. To give an example of how you might do this, observe the following illustration:
|
|
What is the peak value of the resultant (sum) sine-wave? How does this compare with the peak values of the two original sine waves?
|
|
Together, they add to make a third sine wave with a peak value of 5 volts.
Follow-up question: how is it possible that the sum of 3 and 4 makes 5? Hint: you've probably seen something like this when studying trigonometry!
Notes:
Though it may seem a laborious exercise at first, the point of this question is for students to realize that the sum of two equal-frequency sine waves is another sine wave. The peak values of 3 and 4, together with the phase-shift of 90o, was no coincidence on my part when I wrote this question. Where else in mathematics have students seen an example of the quantities 3 and 4 being combined (at 90 degrees) to make a quantity of 5?