Basic oscilloscope operation
Question 1:
An oscilloscope is a very useful piece of electronic test equipment. Most everyone has seen an oscilloscope in use, in the form of a heart-rate monitor (electrocardiogram, or EKG) of the type seen in doctor's offices and hospitals.
When monitoring heart beats, what do the two axes (horizontal and vertical) of the oscilloscope screen represent?
|
|
In general electronics use, when measuring AC voltage signals, what do the two axes (horizontal and vertical) of the oscilloscope screen represent?
|
|
General-purpose vertical = voltage ; General-purpose horizontal = time
Notes:
Oscilloscope function is often best learned through interaction. Be sure to have at least one oscilloscope operational in the classroom for student interaction during discussion time.
Question 2:
The core of an analog oscilloscope is a special type of vacuum tube known as a Cathode Ray Tube, or CRT. While similar in function to the CRT used in televisions, oscilloscope display tubes are specially built for the purpose of serving an a measuring instrument.
Explain how a CRT functions. What goes on inside the tube to produce waveform displays on the screen?
Notes:
Some of your students may come across photographs and illustrations of CRTs for use in their presentation. If at all possible, provide a way for individual students to share their visual findings with their classmates, through the use of an overhead projector, computer monitor, or computer projector. Discuss in detail the operation of a CRT with your students, especially noting the electrostatic method of electron beam deflection used to ßteer" the beam to specific areas on the screen.
Question 3:
When the vertical ("Y") axis of an oscilloscope is shorted, the result should be a straight line in the middle of the screen:
|
|
Determine the DC polarity of the voltage source, based on this illustration:
|
|
|
|
Notes:
This question challenges students to figure out both the polarization of the probe (and ground clip), as well as the orientation of the Y axis. It is very important, of course, that the coupling control be set on "DC" in order to successfully measure a DC signal.
Question 4:
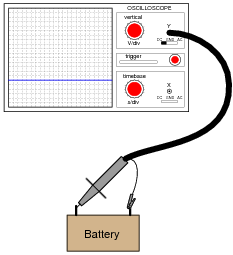
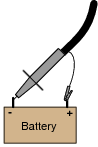
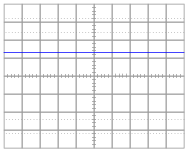
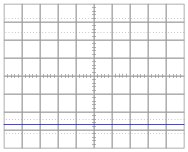
An oscilloscope is connected to a battery of unknown voltage. The result is a straight line on the display:
|
|
Assuming the oscilloscope display has been properly "zeroed" and the vertical sensitivity is set to 5 volts per division, determine the voltage of the battery.
Notes:
Measuring voltage on an oscilloscope display is very similar to measuring voltage on an analog voltmeter. The mathematical relationship between scale divisions and range is much the same. This is one reason I encourage students to use analog multimeters occasionally in their labwork, if for no other reason than to preview the principles of oscilloscope scale interpretation.
Question 5:
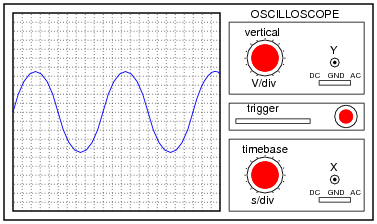
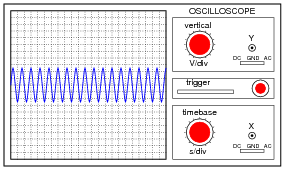
A technician prepares to use an oscilloscope to display an AC voltage signal. After turning the oscilloscope on and connecting the Y input probe to the signal source test points, this display appears:
|
|
What display control(s) need to be adjusted on the oscilloscope in order to show fewer cycles of this signal on the screen, with a greater height (amplitude)?
Notes:
Discuss the function of both these controls with your students. If possible, demonstrate this scenario using a real oscilloscope and function generator, and have students adjust the controls to get the waveform to display optimally. Challenge your students to think of ways the signal source (function generator) may be adjusted to produce the display, then have them think of ways the oscilloscope controls could be adjusted to fit.
Question 6:
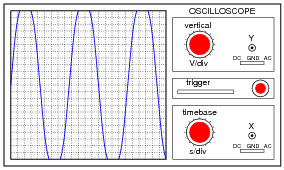
A technician prepares to use an oscilloscope to display an AC voltage signal. After turning the oscilloscope on and connecting the Y input probe to the signal source test points, this display appears:
|
|
What display control(s) need to be adjusted on the oscilloscope in order to show a normal-looking wave on the screen?
Notes:
Discuss the function of both these controls with your students. If possible, demonstrate this scenario using a real oscilloscope and function generator, and have students adjust the controls to get the waveform to display optimally. Challenge your students to think of ways the signal source (function generator) may be adjusted to produce the display, then have them think of ways the oscilloscope controls could be adjusted to fit.
Question 7:
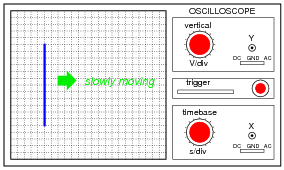
A technician prepares to use an oscilloscope to display an AC voltage signal. After turning the oscilloscope on and connecting the Y input probe to the signal source test points, this display appears:
|
|
What appears on the oscilloscope screen is a vertical line that moves slowly from left to right. What display control(s) need to be adjusted on the oscilloscope in order to show a normal-looking wave on the screen?
Notes:
Discuss the function of both these controls with your students. If possible, demonstrate this scenario using a real oscilloscope and function generator, and have students adjust the controls to get the waveform to display optimally.
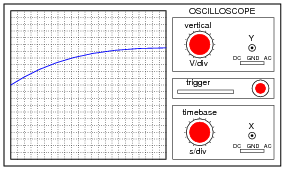
Question 8:
A technician prepares to use an oscilloscope to display an AC voltage signal. After turning the oscilloscope on and connecting the Y input probe to the signal source test points, this display appears:
|
|
What display control(s) need to be adjusted on the oscilloscope in order to show a normal-looking wave on the screen?
Notes:
Discuss the function of both these controls with your students. If possible, demonstrate this scenario using a real oscilloscope and function generator, and have students adjust the controls to get the waveform to display optimally. Challenge your students to think of ways the signal source (function generator) may be adjusted to produce the display, then have them think of ways the oscilloscope controls could be adjusted to fit.
Question 9:
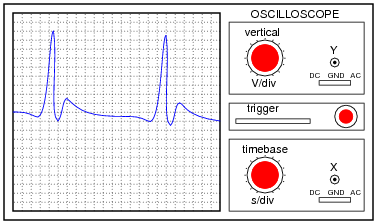
Determine the frequency of this waveform, as displayed by an oscilloscope with a vertical sensitivity of 2 volts per division and a timebase of 0.5 milliseconds per division:
|
|
Notes:
This is just a straightforward exercise in determining period and translating that value into frequency.
Question 10:
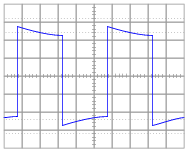
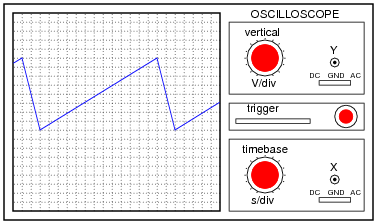
Assuming the vertical sensitivity control is set to 2 volts per division, and the timebase control is set to 10 ms per division, calculate the amplitude of this ßawtooth" wave (in volts peak and volts peak-to-peak) as well as its frequency.
|
|
- Epeak = 8 V
- Epeak-to-peak = 16 V
- f = 6.67 kHz
Notes:
This question is not only good for introducing basic oscilloscope principles, but it is also excellent for review of AC waveform measurements.
Question 11:
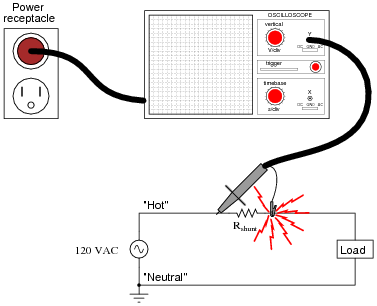
Most oscilloscopes can only directly measure voltage, not current. One way to measure AC current with an oscilloscope is to measure the voltage dropped across a shunt resistor. Since the voltage dropped across a resistor is proportional to the current through that resistor, whatever wave-shape the current is will be translated into a voltage drop with the exact same wave-shape.
However, one must be very careful when connecting an oscilloscope to any part of a grounded system, as many electric power systems are. Note what happens here when a technician attempts to connect the oscilloscope across a shunt resistor located on the "hot" side of a grounded 120 VAC motor circuit:
|
|
Here, the reference lead of the oscilloscope (the small alligator clip, not the sharp-tipped probe) creates a short-circuit in the power system. Explain why this happens.
Notes:
This is a very important lesson for students to learn about line-powered oscilloscopes. If necessary, discuss the wiring of the power system, drawing a schematic showing the complete short-circuit fault current path, from AC voltage source to "hot" lead to ground clip to chassis to ground prong to ground wire to neutral wire to AC voltage source.
Question 12:
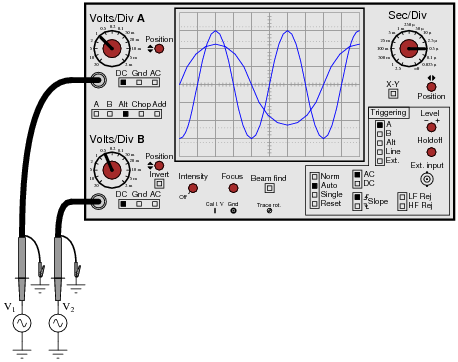
Most oscilloscopes have at least two vertical inputs, used to display more than one waveform simultaneously:
|
|
While this feature is extremely useful, one must be careful in connecting two sources of AC voltage to an oscilloscope. Since the "reference" or "ground" clips of each probe are electrically common with the oscilloscope's metal chassis, they are electrically common with each other as well.
Explain what sort of problem would be caused by connecting a dual-trace oscilloscope to a circuit in the following manner:
|
|
|
|
If the signal generator is earth-grounded through its power cord as well, the problem could even be worse:
|
|
Follow-up question: explain why the second scenario is potentially more hazardous than the first.
Notes:
Failing to consider that the "ground" leads on all probes are common to each other (as well as common to the safety ground conductor of the line power system) is a very common mistake among students first learning how to use oscilloscopes. Hopefully, discussing scenarios such as this will help students avoid this problem in their labwork.
Note to Socratic Electronics developers: the oscilloscope shown in figure 01821x01.eps is made up of individual lines, circles, text elements, etc., rather than a single object as is contained in the Xcircuit library file (scope.lps). If you wish to edit the features of this scope, start with the 01821x01.eps image file rather than the library object! Then you may save your modified oscilloscope as a complete object in your own image library for future use.
Question 13:
Assuming the vertical sensitivity control is set to 0.5 volts per division, and the timebase control is set to 2.5 ms per division, calculate the amplitude of this sine wave (in volts peak, volts peak-to-peak, and volts RMS) as well as its frequency.

|
|
- Epeak = 2.25 V
- Epeak-to-peak = 4.50 V
- ERMS = 1.59 V
- f = 40 Hz
Notes:
This question is not only good for introducing basic oscilloscope principles, but it is also excellent for review of AC waveform measurements.
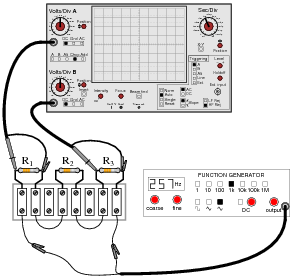
Question 14:
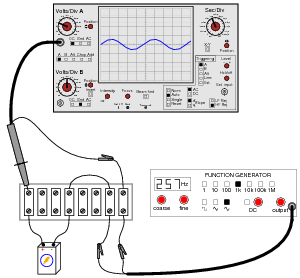
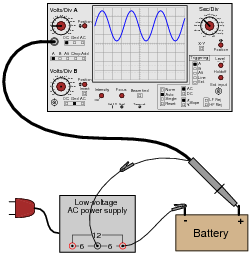
Something is wrong with this circuit. Based on the oscilloscope's display, determine whether the battery or the function generator is faulty:
|
|
Follow-up question: discuss how accidently setting the coupling control on the oscilloscope to ÄC" instead of "DC" would also cause this waveform to show on the screen (even with a good battery).
Notes:
This question challenges students to apply their knowledge of AC+DC mixed signals to oscilloscope display patterns, in order to determine whether it is the battery or the function generator which has failed.
Question 15:
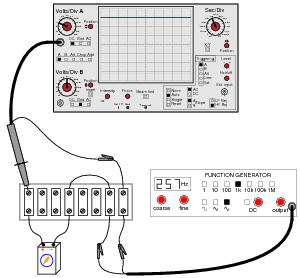
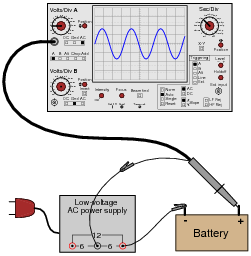
Something is wrong with this circuit. Based on the oscilloscope's display, determine whether the battery or the function generator is faulty:
|
|
Follow-up question: explain how this problem could be created simply by connecting the function generator to the circuit with the ground on the left-hand clip instead of the right-hand clip where it should be.
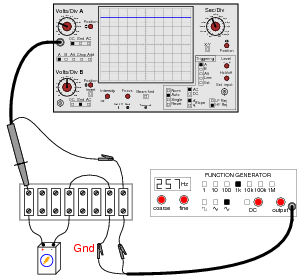
|
|
Notes:
This question challenges students to apply their knowledge of AC+DC mixed signals to oscilloscope display patterns, in order to determine whether it is the battery or the function generator which has failed.
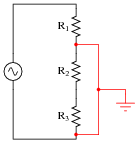
Question 16:
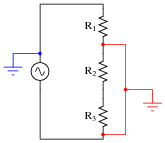
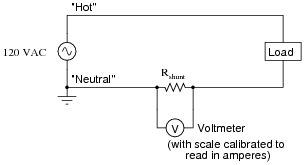
Shunt resistors are low-value, precision resistors used as current-measuring elements in high-current circuits. The idea is to measure the voltage dropped across this precision resistance and use Ohm's Law (I = V/R) to infer the amount of current in the circuit:
|
|
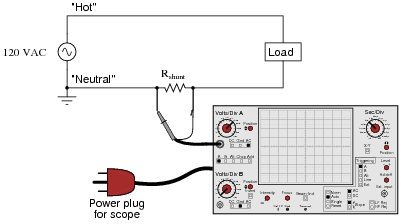
Since the schematic shows a shunt resistor being used to measure current in an AC circuit, it would be equally appropriate to use an oscilloscope instead of a voltmeter to measure the voltage drop produced by the shunt. However, we must be careful in connecting the oscilloscope to the shunt because of the inherent ground reference of the oscilloscope's metal case and probe assembly.
Explain why connecting an oscilloscope to the shunt as shown in this second diagram would be a bad idea:
|
|
Follow-up question: identify a better way of connecting this oscilloscope to the shunt resistor.
Notes:
The ground-referenced clip on an oscilloscope probe is a constant source of potential trouble for those who do not fully understand it! Even in scenarios where there is little or no potential for equipment damage, placing an earth ground reference on a circuit via the probe clip can make for very strange circuit behavior and erroneous measurements. Problems like this frequently occur when new students attempt to connect their oscilloscopes to circuits powered by signal generators whose outputs are also earth-ground referenced.
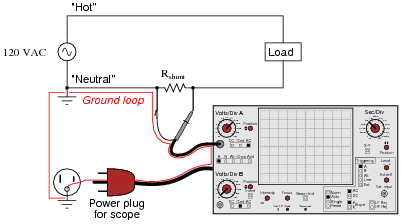
In response to the follow-up question, the most obvious answer is to reverse the probe connections: ground clip on the left-hand terminal and probe tip on the right-hand terminal. However, even this might not be the best idea, since it creates a "ground loop" between the oscilloscope and the ground connection at the AC source:
|
|
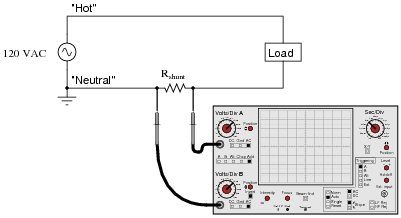
Ground loops are to be avoided in measurement circuits because they may be the source of some very strange effects, including the coupling of noise voltage from entirely unrelated circuits to the one being measured. To avoid this problem, the best solution for measuring the voltage dropped across the shunt resistor is to use two scope probes and set the scope up for differential voltage measurement:
|
|
Question 17:
An oscilloscope is connected to a battery of unknown voltage. The result is a straight line on the display:
|
|
Assuming the oscilloscope display has been properly "zeroed" and the vertical sensitivity is set to 2 volts per division, determine the voltage of the battery.
Notes:
Measuring voltage on an oscilloscope display is very similar to measuring voltage on an analog voltmeter. The mathematical relationship between scale divisions and range is much the same. This is one reason I encourage students to use analog multimeters occasionally in their labwork, if for no other reason than to preview the principles of oscilloscope scale interpretation.
Question 18:
One of the more complicated controls to master on an oscilloscope, but also one of the most useful, is the triggering control. Without proper "triggering," a waveform will scroll horizontally across the screen rather than staying "locked" in place.
Describe how the triggering control is able to "lock" an AC waveform on the screen so that it appears stable to the human eye. What, exactly, is the triggering function doing that makes an AC waveform appear to stand still?
Notes:
For students who have every used a ßtrobe" or "timing" light to make a rotating object appear to "freeze" in place, the concept of oscilloscope triggering makes perfect sense. In fact, a strobe light and a rotating object such as a fan work very well to illustrate the concept of having to "flash" at just the right times in order to make something moving appear to be still.
An interesting comparison to make is between a strobe light (freezing the motion of a fan) set to a frequency that is slightly öff" sync - thereby causing the rotating object to appear to move very slowly - and an oscilloscope with the triggering turned off, and the horizontal sweep speed set in the same manner, adjusted to make the AC waveform horizontally scroll across the screen.
Once your students have seen this comparison, ask them to describe what would be necessary to "trigger" a strobe light so that the moving object always appears to stand still, and cannot ßcroll" due to a mismatch in frequencies.
Question 19:
If an oscilloscope is connected to a series combination of AC and DC voltage sources, what is displayed on the oscilloscope screen depends on where the "coupling" control is set.
With the coupling control set to "DC", the waveform displayed will be elevated above (or depressed below) the "zero" line:
|
|
Setting the coupling control to ÄC", however, results in the waveform automatically centering itself on the screen, about the zero line.
|
|
Based on these observations, explain what the "DC" and ÄC" settings on the coupling control actually mean.
Notes:
A common misconception among students is that the "DC" setting is used for measuring DC signals only, and that the ÄC" setting is used for measuring AC signals only. I often refer to the "DC" setting as direct coupling in order to avoid the connotation of "direct current," in an attempt to reinforce the idea that with "DC" coupling, what you see is all that's really there. With ÄC" coupling, only part of the signal is being coupled to the input amplifier circuitry.
Question 20:
Explain what happens inside an oscilloscope when the "coupling" switch is moved from the "DC" position to the ÄC" position.
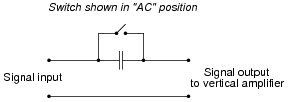
|
|
Notes:
In order for students to answer this question, they must review the internal operation of an oscilloscope. This does not have to be rigorous - a block-diagram understanding is good enough. The important thing is that they understand what the capacitor does for the oscilloscope input. Once this is understood, students will have a much better understanding of why and where the coupling control is used.
Question 21:
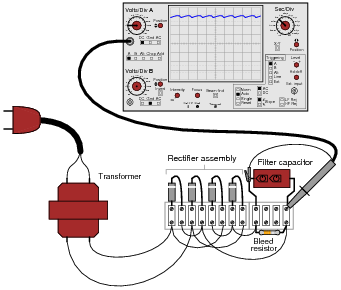
Suppose a technician measures the voltage output by an AC-DC power supply circuit:
|
|
The waveform shown by the oscilloscope is mostly DC, with just a little bit of AC "ripple" voltage appearing as a ripple pattern on what would otherwise be a straight, horizontal line. This is quite normal for the output of an AC-DC power supply.
Suppose we wished to take a closer view of this "ripple" voltage. We want to make the ripples more pronounced on the screen, so that we may better discern their shape. Unfortunately, though, when we decrease the number of volts per division on the "vertical" control knob to magnify the vertical amplification of the oscilloscope, the pattern completely disappears from the screen!
Explain what the problem is, and how we might correct it so as to be able to magnify the ripple voltage waveform without having it disappear off the oscilloscope screen.
Follow-up question: predict the frequency of the ripple voltage in this power supply circuit.
Notes:
As usual, what I'm looking for in an answer here is an explanation for what is happening. If a student simply tells you, "the vertical input is DC-coupled," press them for more detail. What does it mean for the input to be "DC-coupled," and why does this cause the line to disappear from the screen when we increase the vertical sensitivity? What alternative do we have to "DC coupling" on an oscilloscope?
One nice thing about oscilloscopes is that they cannot be damaged by "pegging" the display, as can analog multimeters. The same concept applies, though, and is useful in explaining to students why waveforms disappear from the screen when the vertical sensitivity is too great.
Question 22:
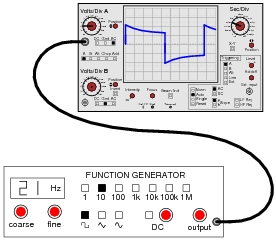
A student just learning to use oscilloscopes connects one directly to the output of a signal generator, with these results:
|
|
As you can see, the function generator is configured to output a square wave, but the oscilloscope does not register a square wave. Perplexed, the student takes the function generator to a different oscilloscope. At the second oscilloscope, the student sees a proper square wave on the screen:

|
|
It is then that the student realizes the first oscilloscope has its "coupling" control set to AC, while the second oscilloscope was set to DC. Now the student is really confused! The signal is obviously AC, as it oscillates above and below the centerline of the screen, but yet the "DC" setting appears to give the most accurate results: a true-to-form square wave.
How would you explain what is happening to this student, and also describe the appropriate uses of the ÄC" and "DC" coupling settings so he or she knows better how to use it in the future?
Notes:
The answer I give here is correct, but does not address why the coupling control does what it does, nor does it describe why the square wave signal appears all distorted on the first oscilloscope's screen. I leave this for your students to research and for you and your students to discuss together in class.
Question 23:
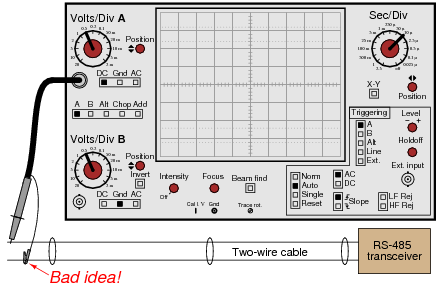
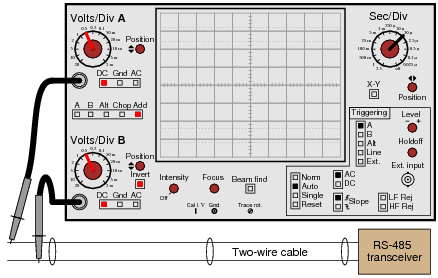
There are times when you need to use an oscilloscope to measure a differential voltage that also has a significant common-mode voltage: an application where you cannot connect the oscilloscope's ground lead to either point of contact. One application is measuring the voltage pulses on an RS-485 digital communications network, where neither conductor in the two-wire cable is at ground potential, and where connecting either wire to ground (via the oscilloscope's ground clip) may cause problems:
|
|
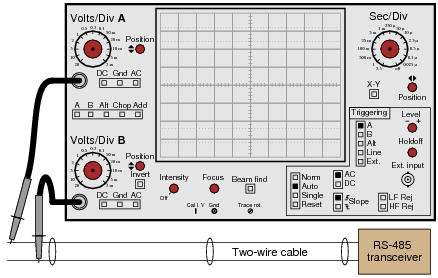
One solution to this problem is to use both probes of a dual-trace oscilloscope, and set it up for differential measurement. In this mode, only one waveform will be shown on the screen, even though two probes are being used. No ground clips need be connected to the circuit under test, and the waveform shown will be indicative of the voltage between the two probe tips.
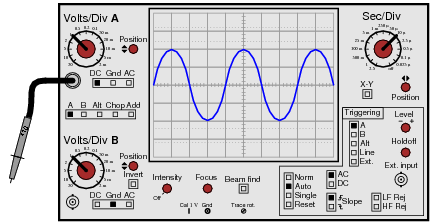
Describe how a typical oscilloscope may be set up to perform differential voltage measurement. Be sure to include descriptions of all knob and button settings (with reference to the oscilloscope shown in this question):
|
|
|
|
- �
- Both channels must be set to same vertical sensitivity (volts/division)
- �
- Both channels should be set for same vertical coupling (both DC or both AC)
- �
- Channel selection must be set to Ädd"
- �
- One channel must be inverted (this turns the äddition" into ßubtraction")
Notes:
This question is best followed by a demonstration or a lab exercise where students get to see firsthand how it works.
Question 24:
A very common accessory for oscilloscopes is a ×10 probe, which effectively acts as a 10:1 voltage divider for any measured signals. Thus, an oscilloscope showing a waveform with a peak-to-peak amplitude of 4 divisions, with a vertical sensitivity setting of 1 volt per division, using a ×10 probe, would actually be measuring a signal of 40 volts peak-peak:
|
|
Obviously, one use for a ×10 probe is measuring voltages beyond the normal range of an oscilloscope. However, there is another application that is less obvious, and it regards the input impedance of the oscilloscope. A ×10 probe gives the oscilloscope 10 times more input impedance (as seen from the probe tip to ground). Typically this means an input impedance of 10 MW (with the ×10 probe) rather than 1 MW (with a normal 1:1 probe). Identify an application where this feature could be useful.
Notes:
Increased input impedance is often a more common reason for choosing ×10 probes, as opposed to increased voltage measurement range. The answer to this question is more readily grasped by students after they have worked with loading-sensitive electronic circuits.
Question 25:
Explain what an active probe is for an oscilloscope, and why they are useful for some measurement applications.
Follow-up question: can you think of any disadvantages of active probes? In other words, reasons why an old-fashioned passive probe would be a better choice than an active probe for signal measurement?
Notes:
One place your students might wish to research in answering this question is a technical specifications page for different oscilloscope probes. By comparing the specs of active versus passive probes, the advantages (and disadvantages) should become evident.