Inductor transient response
Inductors have the exact opposite characteristics of capacitors. Whereas capacitors store energy in an electric field (produced by the voltage between two plates), inductors store energy in a magnetic field (produced by the current through wire). Thus, while the stored energy in a capacitor tries to maintain a constant voltage across its terminals, the stored energy in an inductor tries to maintain a constant current through its windings. Because of this, inductors oppose changes in current, and act precisely the opposite of capacitors, which oppose changes in voltage. A fully discharged inductor (no magnetic field), having zero current through it, will initially act as an open-circuit when attached to a source of voltage (as it tries to maintain zero current), dropping maximum voltage across its leads. Over time, the inductor's current rises to the maximum value allowed by the circuit, and the terminal voltage decreases correspondingly. Once the inductor's terminal voltage has decreased to a minimum (zero for a "perfect" inductor), the current will stay at a maximum level, and it will behave essentially as a short-circuit.
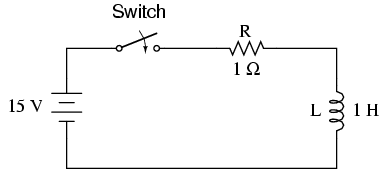
When the switch is first closed, the voltage across the inductor will immediately jump to battery voltage (acting as though it were an open-circuit) and decay down to zero over time (eventually acting as though it were a short-circuit). Voltage across the inductor is determined by calculating how much voltage is being dropped across R, given the current through the inductor, and subtracting that voltage value from the battery to see what's left. When the switch is first closed, the current is zero, then it increases over time until it is equal to the battery voltage divided by the series resistance of 1 Ω. This behavior is precisely opposite that of the series resistor-capacitor circuit, where current started at a maximum and capacitor voltage at zero. Let's see how this works using real values:
---------------------------------------------
|   Time   | Battery | Inductor  | Current  |
|(seconds) | voltage |  voltage  |          |
|-------------------------------------------|
|    0     |   15 V  |    15 V   |    0     |
|-------------------------------------------|
|   0.5    |   15 V  |  9.098 V  |  5.902 A |
|-------------------------------------------|
|    1     |   15 V  |  5.518 V  |  9.482 A |
|-------------------------------------------|
|    2     |   15 V  |  2.030 V  |  12.97 A |
|-------------------------------------------|
|    3     |   15 V  |  0.747 V  |  14.25 A |
|-------------------------------------------|
|    4     |   15 V  |  0.275 V  |  14.73 A |
|-------------------------------------------|
|    5     |   15 V  |  0.101 V  |  14.90 A |
|-------------------------------------------|
|    6     |   15 V  | 37.181 mV |  14.96 A |
|-------------------------------------------|
|    10    |   15 V  |  0.681 mV |  14.99 A |
---------------------------------------------
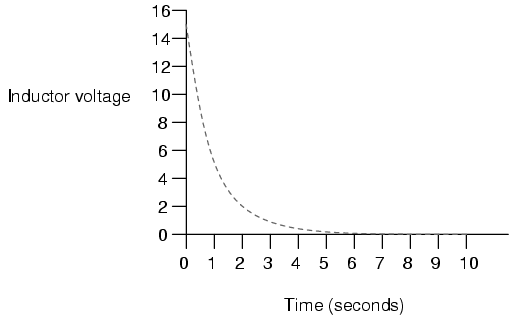
Just as with the RC circuit, the inductor voltage's approach to 0 volts and the current's approach to 15 amps over time is asymptotic. For all practical purposes, though, we can say that the inductor voltage will eventually reach 0 volts and that the current will eventually equal the maximum of 15 amps.
Again, we can use the SPICE circuit analysis program to chart this asymptotic decay of inductor voltage and buildup of inductor current in a more graphical form (inductor current is plotted in terms of voltage drop across the resistor, using the resistor as a shunt to measure current):
inductor charging
v1 1 0 dc 15
r1 1 2 1
l1 2 0 1 ic=0
.tran .5 10 uic
.plot tran v(2,0) v(1,2)
.end
legend:

*: v(2)   Inductor voltage
+: v(1,2) Inductor current

time             v(2)

(*+)------------ 0.000E+00     5.000E+00     1.000E+01     1.500E+01
- - - - - - - - - - - - - - - - - - - - - - - - - - - - - - - - -
0.000E+00  1.500E+01 +             .             .             *
5.000E-01  9.119E+00 .             . +         * .             .
1.000E+00  5.526E+00 .             .*           +.             .
1.500E+00  3.343E+00 .        *    .             .    +        .
2.000E+00  2.026E+00 .     *       .             .       +     .
2.500E+00  1.226E+00 .  *          .             .          +  .
3.000E+00  7.429E-01 . *           .             .           + .
3.500E+00  4.495E-01 .*            .             .            +.
4.000E+00  2.724E-01 .*            .             .            +.
4.500E+00  1.648E-01 *             .             .             +
5.000E+00  9.987E-02 *             .             .             +
5.500E+00  6.042E-02 *             .             .             +
6.000E+00  3.662E-02 *             .             .             +
6.500E+00  2.215E-02 *             .             .             +
7.000E+00  1.343E-02 *             .             .             +
7.500E+00  8.123E-03 *             .             .             +
8.000E+00  4.922E-03 *             .             .             +
8.500E+00  2.978E-03 *             .             .             +
9.000E+00  1.805E-03 *             .             .             +
9.500E+00  1.092E-03 *             .             .             +
1.000E+01  6.591E-04 *             .             .             +
- - - - - - - - - - - - - - - - - - - - - - - - - - - - - - - - -
Notice how the voltage decreases (to the left of the plot) very quickly at first, then tapering off as time goes on. Current also changes very quickly at first then levels off as time goes on, but it is approaching maximum (right of scale) while voltage approaches minimum.
- REVIEW:
- A fully "discharged" inductor (no current through it) initially acts as an open circuit (voltage drop with no current) when faced with the sudden application of voltage. After "charging" fully to the final level of current, it acts as a short circuit (current with no voltage drop).
- In a resistor-inductor "charging" circuit, inductor current goes from nothing to full value while voltage goes from maximum to zero, both variables changing most rapidly at first, approaching their final values slower and slower as time goes on.